Socioeconomic GIS Analysis
How does the diversity of housing choice affect individuals’ means of transportation in California? To answer this question, I created a housing diversity index, ran OLS regressions, and produced bivariate maps.
Background and Problem Formulation
Different types of housing are often located in distinct neighborhoods with varying levels of access to transportation infrastructure (Tian et al. 2019)
Housing diversity reflects the mix of land use and zoning regulations within a community (mixed-use development and higher-density housing can create more walkable, bikeable, and well-connected environments)
More varieties of housing choices may be associated with socioeconomic diversity and affordability, attracting residents with varying income levels (Clark et al. 2022)
Wider ranges of housing options can have implications for environmental sustainability and transportation emissions
Data Assembly: OLS Regression
Census Data from the American Community Survey: 2022
Median Household Income in the Past 12 months
B19013_001: Total Income (Scaled using Min-Max Method)
Commuting Characteristics
S0801_C01_003E: Drove alone
S0801_C01_004E: Carpooled
S0801_C01_009E: Public transportation (excluding taxicab)
S0801_C01_010E: Walked
S0801_C01_011E: Bicycle
S0801_C01_012E: Taxicab, motorcycle, or other means
S0801_C01_013E: Worked from home
DP04_0058PE: No vehicles available
Conclusions
This study found evidence of a relationship between housing diversity and transportation modes in California, with areas with more diversity of housing choice possibly leading to more bicycle usage (especially in urban settings and college towns with intentional bicycle infrastructure)
Limitations include data availability, choice of variables related to home values, lack of transportation index
A further study on the impacts of green gentrification would be beneficial
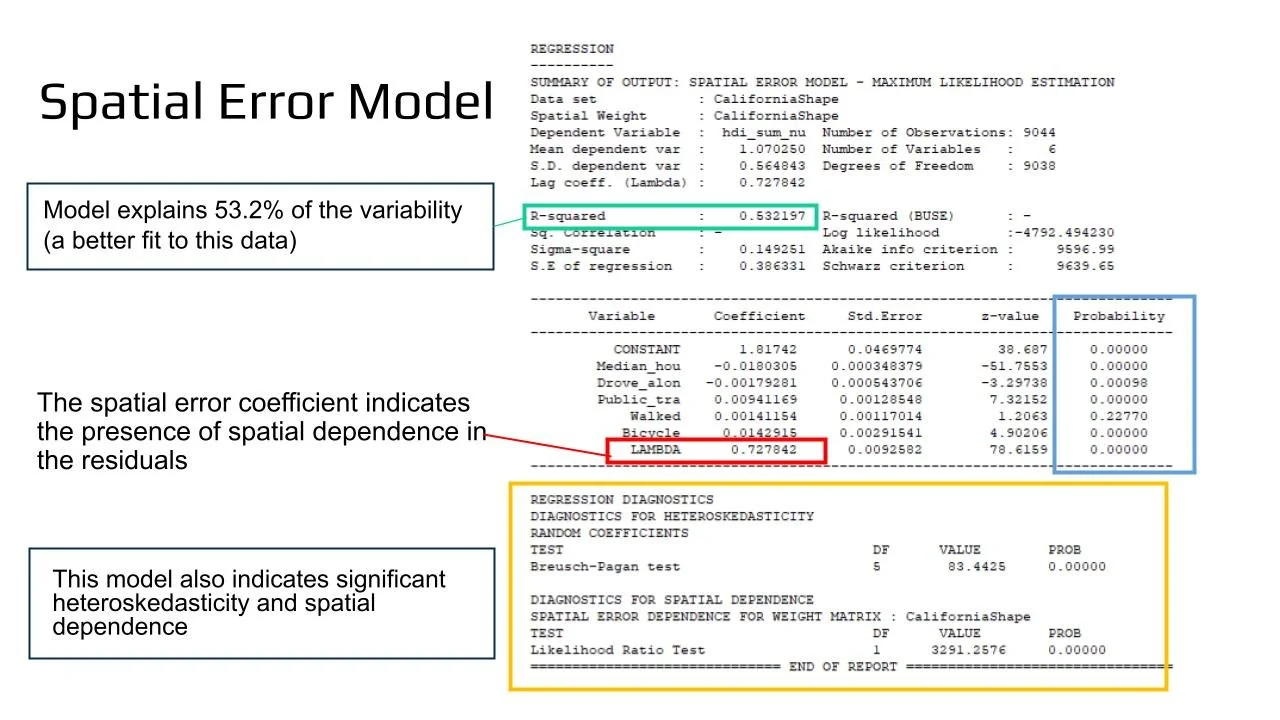
Due to high heteroskedasticity, other spatial regression models may be more successful in future research that could explore additional factors of influence
The findings suggest the importance of promoting bicycle-friendly infrastructure and policies to enhance quality of life
References
City of Santa Monica. (n.d.). Santamonica.gov - Bike Action Plan Amendment. https://www.santamonica.gov/mobility-projects/bike-action-plan-amendment
Clark, W. a. V., ViforJ, R. O., & Truong, N. K. (2021). Neighbourhood selection and neighbourhood matching: Choices, outcomes and social distance. Urban Studies, 59(5), 937–955. https://doi.org/10.1177/00420980211044029
SFMTA. (2023) Bicycle Ridership data. SFMTA. https://www.sfmta.com/bicycle-ridership-data
Tian, G., Park, K., & Ewing, R. (2018). Trip and parking generation rates for different housing types: Effects of compact development. Urban Studies, 56(8), 1554–1575. https://doi.org/10.1177/0042098018770075
U.S. Census Bureau, Median Household Income, https://data.census.gov/table/ACSDT1Y2022.B19013?q=B19013_001
U.S. Census Bureau, Commuting Characteristics by Sex, https://data.census.gov/table/ACSST1Y2022.S0801?q=S0801
U.S. Census Bureau, TIGER/Line Shapefile, 2021, State, California, Census Tracts, https://catalog.data.gov/dataset/tiger-line-shapefile-2021-state-california-census-tracts


